fatf.vis.lime.plot_lime
-
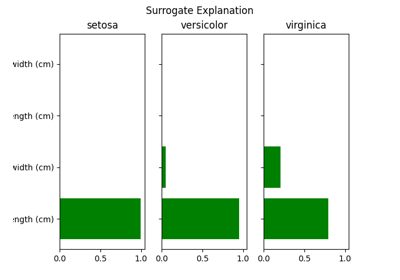
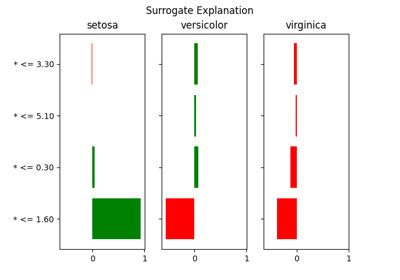
fatf.vis.lime.plot_lime(surrogate_explanation: Union[Dict[str, float], Dict[str, Dict[str, float]]]) → matplotlib.figure.Figure[source]¶ Plots an importance-based surrogate explanation, e.g., LIME.
This plotting function is intended for the
fatf.transparency.predictions.surrogate_explainers.TabularBlimeyLimeandfatf.transparency.predictions.surrogate_explainers.TabularBlimeyTreeexplainers. When multiple explanations are provided, they will share a common y-axis if they use the same set of interpretable features.- Parameters
- surrogate_explanationDictionary[string, float] or Dictionary[string, Dictionary[string, float]]
An explanation returned by the
explain_instancemethod of a surrogate explainer. For a classifier this will be a dictionary where the keys are class names and the values are dictionaries where the key is an interpretable feature name and the value is the importance of this interpretable feature. For regressor explanations this will be a dictionary where the key is an interpretable feature name and the value is the importance of this interpretable feature.Changed in version 0.1.0: Dropped support for LIME explanation format:
List[Tuple[string, float]]for regressors andDictionary[string, List[Tuple[string, float]]]for probabilistic classifiers.Changed in version 0.0.2: Support for surrogate explainer explanations of the form:
Dictionary[string, Dictionary[string, float]].
- Returns
- figurematplotlib.pyplot.Figure
A matplotlib figure with subplots explaining every label in a surrogate explanation.
- Raises
- TypeError
The
surrogate_explanationparameter is not a dictionary. One of the class names is not a string. One of the interpretable feature names is not a string. One of the importance values is not a number.- ValueError
One of the explanations is an empty dictionary.