Note
Click here to download the full example code or run this example in your browser via Binder
Using LIME Image Explainer
This example illustrates how to use the LIME image explainer to explain a prediction.
This example shows how to use the image LIME implementation –
fatf.transparency.predictions.surrogate_image_explainers.ImageBlimeyLime
– to explain a prediction of a black-box probabilistic model.

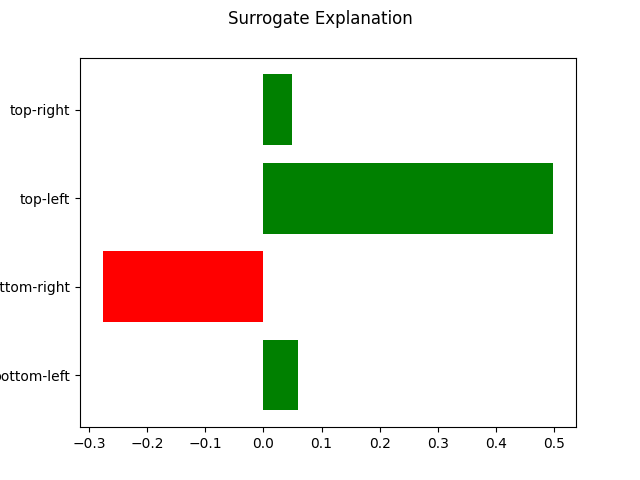
Out:
{'bottom-left': 0.059825904043669643,
 'bottom-right': -0.27639956335921306,
 'top-left': 0.4983489307756843,
 'top-right': 0.04997774025460273}
# Author: Kacper Sokol <k.sokol@bristol.ac.uk>
# License: new BSD

from pprint import pprint

import matplotlib.pyplot as plt
import numpy as np

import fatf

import fatf.utils.models as fatf_models

import fatf.transparency.predictions.surrogate_image_explainers as fatf_exp

import fatf.vis.lime as fatf_vis_lime

print(__doc__)

# Fix random seed
fatf.setup_random_seed(42)

# Create a simple data set
r, g, b, k = [255, 0, 0], [0, 255, 0], [0, 0, 255], [0, 0, 0]
X = np.array(
    [
        [[r, g], [b, k]],
        [[r, b], [g, k]],
        [[r, k], [b, g]],
        [[k, g], [b, r]],
        [[k, b], [g, r]],
        [[g, k], [b, r]]
    ],
    dtype=np.uint8
)
y = np.array([0, 0, 0, 1, 1, 1])

feature_names = {
  'Segment #1': 'top-left',
  'Segment #2': 'top-right',
  'Segment #3': 'bottom-left',
  'Segment #4': 'bottom-right'
}
class_names = {0: 'top-left-red', 1: 'bottom-right-red'}

# Create a model that operates of 3-D images
class KNNimg(fatf_models.KNN):
    def fit(self, X, y):
        X_r_flat = np.array([i[:, :, 0].flatten() for i in X], dtype=np.uint8)
        super().fit(X_r_flat, y)

    def predict(self, X):
        X_r_flat = np.array([i[:, :, 0].flatten() for i in X], dtype=np.uint8)
        return super().predict(X_r_flat)

    def predict_proba(self, X):
        X_r_flat = np.array([i[:, :, 0].flatten() for i in X], dtype=np.uint8)
        return super().predict_proba(X_r_flat)

# Train a model
clf = KNNimg(k=1)
clf.fit(X, y)

# Choose an instance to be explained
image = X[0]
image_class = 0

# Display the instance
plt.axis('off')
plt.imshow(image)

# Create a LIME image explainer
lime = fatf_exp.ImageBlimeyLime(
    image,
    clf,
    ratio=1,
    kernel_size=1.05,
    max_dist=10,
    colour='random')

# Explain an instance
lime_explanation_ = lime.explain_instance(explained_class=image_class)

# Remap the explanation
lime_explanation = {feature_names[i]: j for i, j in lime_explanation_.items()}

# Display the textual explanation
pprint(lime_explanation)

# Plot the explanation
fatf_vis_lime.plot_lime(lime_explanation)
Total running time of the script: ( 0 minutes 0.216 seconds)

