Note
Click here to download the full example code or run this example in your browser via Binder
Using Partial Dependence Explainer
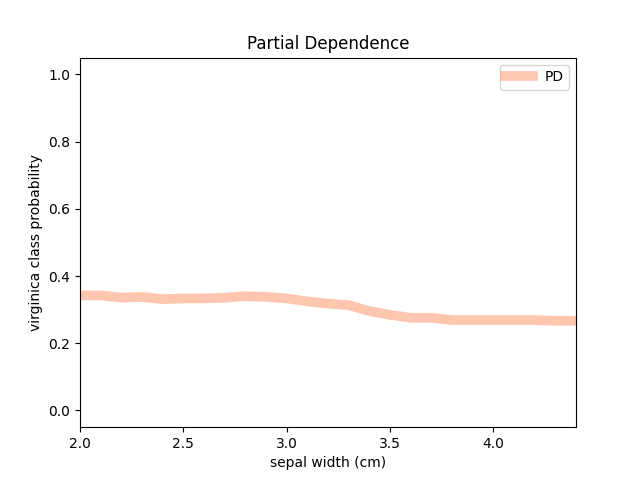
This example illustrates how to use the Partial Dependence (PD) explainer and
its plotting function. This example only shows how to get the PD array straight
from the data. The calculation of PD required to compute the Individual
Conditional Expectation (ICE) as part of the process. By using the
fatf.transparency.models.feature_influence.partial_dependence function
the ICE array is computed, however it is never returned back to the user. If
you want to inspect both ICE and PD then please have a look at the
Using Partial Dependence Explainer
example and the two following functions:
fatf.transparency.models.feature_influence.individual_conditional_expectation,fatf.transparency.models.feature_influence.partial_dependence_ice.

Out:
Explaining feature (index: 1): sepal width (cm).
Explaining class (index: 2): virginica.
# Author: Kacper Sokol <k.sokol@bristol.ac.uk>
# License: new BSD

import fatf.utils.data.datasets as fatf_datasets
import fatf.utils.models as fatf_models

import fatf.transparency.models.feature_influence as fatf_fi

import fatf.vis.feature_influence as fatf_vis_fi

print(__doc__)

# Load data
iris_data_dict = fatf_datasets.load_iris()
iris_X = iris_data_dict['data']
iris_y = iris_data_dict['target'].astype(int)
iris_feature_names = iris_data_dict['feature_names']
iris_class_names = iris_data_dict['target_names']

# Train a model
clf = fatf_models.KNN()
clf.fit(iris_X, iris_y)

# Select a feature to be explained
selected_feature_index = 1
selected_feature_name = iris_feature_names[selected_feature_index]
print('Explaining feature (index: {}): {}.'.format(selected_feature_index,
                                                   selected_feature_name))

# Select class for which the explanation will be produced
explanation_class = 2
explanation_class_name = iris_class_names[explanation_class]
print('Explaining class (index: {}): {}.'.format(explanation_class,
                                                 explanation_class_name))

# Define the number of samples to be generated (granularity of the explanation)
linspace_samples = 25

# Calculate Partial Dependence
pd_array, pd_linspace = fatf_fi.partial_dependence(
    iris_X, clf, selected_feature_index, steps_number=linspace_samples)

# Plot Partial Dependence on its own
pd_plot_clean = fatf_vis_fi.plot_partial_dependence(
    pd_array,
    pd_linspace,
    explanation_class,
    class_name=explanation_class_name,
    feature_name=selected_feature_name)
Total running time of the script: ( 0 minutes 12.853 seconds)

