fatf.vis.feature_influence.plot_partial_dependence
-
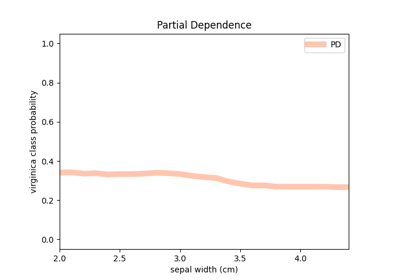
fatf.vis.feature_influence.plot_partial_dependence(pd_array: numpy.ndarray, feature_linespace: numpy.ndarray, class_index: int, feature_name: Optional[str] = None, class_name: Optional[str] = None, plot_axis: Optional[matplotlib.axes._axes.Axes] = None) → Tuple[Optional[matplotlib.figure.Figure], matplotlib.axes._axes.Axes][source]¶ Plots Partial Dependence for a selected class.
This function raises the same exceptions and errors as the
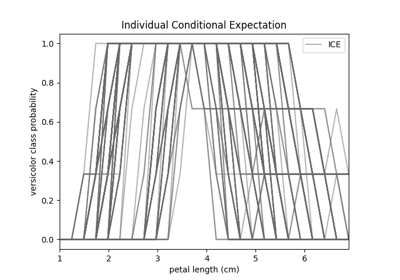
fatf.vis.feature_influence.plot_individual_conditional_expectationfunction. Please consult its documentation for the exact list or errors and exceptions and their description.- Parameters
- pd_arraynumpy.ndarray
An array of (n_steps, n_classes) shape with Partial Dependence calculation results for every target class for the desired spectrum of the selected feature. This should be the output of the
fatf.transparency.models.feature_influence.partial_dependenceorfatf.transparency.models.feature_influence.partial_dependence_icefunction.- feature_linespacenumpy.ndarray
A one-dimensional array – (steps_number, ) – with the values for which the selected feature was sampled when the dataset was evaluated for a predictive model. This should be the output of the
fatf.transparency.models.feature_influence.individual_conditional_expectationfunction.- class_indexinteger
The index of the class for which PD will be plotted, taken from the original dataset.
- feature_namestring, optional (default=None)
The name of the feature for which PD was originally calculated.
- class_namestring, optional (default=None)
The name of the class that
class_indexparameter points to. IfNone, the class name will be the same as the class index.- plot_axismatplotlib.pyplot.Axes, optional (default=None)
A matplotlib axes on which the PD will be plotted. This is useful if one wants to overlay PD onto an ICE plot. If
None, a new axes will be created.
- Returns
- plot_figureUnion[matplotlib.pyplot.Figure, None]
A matplotlib figure that holds the
plot_axisaxis. This parameter isNonewhen the user passed inplot_axisattribute, otherwise, when a blank plot is created, this is a figure object holding the plot axis (plot_axis).- plot_axismatplotlib.pyplot.Axes
A matplotlib axes with the PD plot.