fatf.vis.feature_influence.plot_individual_conditional_expectation
-
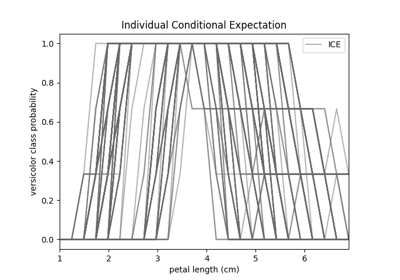
fatf.vis.feature_influence.plot_individual_conditional_expectation(ice_array: numpy.ndarray, feature_linespace: numpy.ndarray, class_index: int, feature_name: Optional[str] = None, class_name: Optional[str] = None, plot_axis: Optional[matplotlib.axes._axes.Axes] = None) → Tuple[Optional[matplotlib.figure.Figure], matplotlib.axes._axes.Axes][source]¶ Plots Individual Conditional Expectation for a selected class.
- Parameters
- ice_arraynumpy.ndarray
An array of (n_samples, n_steps, n_classes) shape with Individual Conditional Expectation calculation results for every target class for the desired spectrum of the selected feature. This should be the output of the
fatf.transparency.models.feature_influence.individual_conditional_expectationfunction.- feature_linespacenumpy.ndarray
A one-dimensional array – (steps_number, ) – with the values for which the selected feature was sampled when the dataset was evaluated for a predictive model. This should be the output of the
fatf.transparency.models.feature_influence.individual_conditional_expectationfunction.- class_indexinteger
The index of the class for which ICE will be plotted, taken from the original dataset.
- feature_namestring, optional (default=None)
The name of the feature for which ICE was originally calculated.
- class_namestring, optional (default=None)
The name of the class that
class_indexparameter points to. IfNone, the class name will be the same as the class index.- plot_axismatplotlib.pyplot.Axes, optional (default=None)
A matplotlib axes on which the ICE will be plotted. This is useful if one wants to overlay multiple ICE plot on top of each other. If
None, a new axes will be created.
- Returns
- plot_figureUnion[matplotlib.pyplot.Figure, None]
A matplotlib figure that holds the
plot_axisaxis. This parameter isNonewhen the user passed inplot_axisattribute, otherwise, when a blank plot is created, this is a figure object holding the plot axis (plot_axis).- plot_axismatplotlib.pyplot.Axes
A matplotlib axes with the ICE plot.
- Raises
- IncorrectShapeError
The ICE or the PD array has a wrong number of dimensions (3 and 2 respectively). The feature linespace array has a wrong number of dimensions – 1 is expected.
- IndexError
The class index is invalid for the input array.
- TypeError
The class index is not an integer; the feature name is not a string or a
None; the class name is not a string or aNone; the plot axis is not a matplotlib.pyplot.Axes type object or aNone.- ValueError
The input array is structured or is not numerical. The linespace array is structured, not numerical or its length does not agree with the number of steps in the input array. If the
plot_axisattribute is provided, and is notNonethis exception will be raised if the range of either of the axes does not agree with the range of the axes of theplot_axisplot.