Note
Click here to download the full example code or run this example in your browser via Binder
Using LIME Explainer
This example illustrates how to use the LIME tabular explainer to explain a prediction.
This example shows how to use the tabular LIME implementation –
fatf.transparency.predictions.surrogate_explainers.TabularBlimeyLime
– to explain a prediction of a black-box probabilistic model.
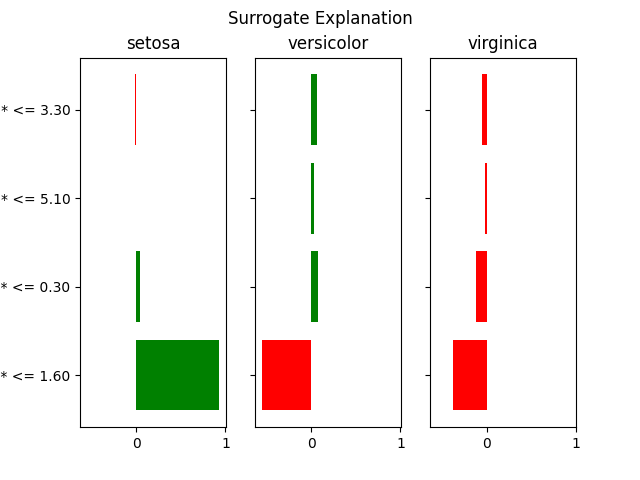
Out:
{'setosa': {'*petal length (cm)* <= 1.60': 0.9307866199252784,
            '*petal width (cm)* <= 0.30': 0.04259129805843401,
            '*sepal length (cm)* <= 5.10': -0.0027663756624473936,
            '3.00 < *sepal width (cm)* <= 3.30': -0.011263216273426888},
 'versicolor': {'*petal length (cm)* <= 1.60': -0.5593822883064358,
                '*petal width (cm)* <= 0.30': 0.07065024115814264,
                '*sepal length (cm)* <= 5.10': 0.025538640983435418,
                '3.00 < *sepal width (cm)* <= 3.30': 0.0663293593939103},
 'virginica': {'*petal length (cm)* <= 1.60': -0.37140433161884245,
               '*petal width (cm)* <= 0.30': -0.11324153921657666,
               '*sepal length (cm)* <= 5.10': -0.022772265320988014,
               '3.00 < *sepal width (cm)* <= 3.30': -0.05506614312048342}}
# Author: Kacper Sokol <k.sokol@bristol.ac.uk>
# License: new BSD

from pprint import pprint

import fatf

import fatf.utils.data.datasets as fatf_datasets
import fatf.utils.models as fatf_models

import fatf.transparency.predictions.surrogate_explainers as fatf_surrogates

import fatf.vis.lime as fatf_vis_lime

print(__doc__)

# Fix random seed
fatf.setup_random_seed(42)

# Load data
iris_data_dict = fatf_datasets.load_iris()
iris_X = iris_data_dict['data']
iris_y = iris_data_dict['target']
iris_feature_names = iris_data_dict['feature_names'].tolist()
iris_class_names = iris_data_dict['target_names'].tolist()

# Train a model
clf = fatf_models.KNN()
clf.fit(iris_X, iris_y)

# Create a LIME explainer
lime = fatf_surrogates.TabularBlimeyLime(
    iris_X,
    clf,
    feature_names=iris_feature_names,
    class_names=iris_class_names)

# Choose an index of the instance to be explained
index_to_explain = 42

# Explain an instance
lime_explanation = lime.explain_instance(
    iris_X[index_to_explain, :], samples_number=500)

# Display the textual explanation
pprint(lime_explanation)

# Plot the explanation
fatf_vis_lime.plot_lime(lime_explanation)
Total running time of the script: ( 0 minutes 1.705 seconds)

